
Siege benchmark test #2: Internet mode
Created text file centminmod.txt - entering site url links one per line.
http://centmin.sh/index.html
http://centmin.sh/faq.html
http://centmin.sh/changelog.html
http://centmin.sh/siegebenchmark_nginx.html
http://centmin.sh/apachebench_nginx.html
Ran Siege benchmark in internet mode with 300 concurrent users and 100 repetitions with a 0-5 second delay. I wrote a logstats.sh bash script which logs top and free -m stats output every 1 second for web1, web2 and web3 servers. The logstats.sh bash script then allows filtering output by cpu and memory stats to figure out peak cpu and memory usage loads.
Click one of the 3 buttons below to view full filtered stats for each web1, web2, web3.
siege -i -c300 -r100 -d5 -f centminmod.txt
** SIEGE 2.70
** Preparing 300 concurrent users for battle.
The server is now under siege...
HTTP/1.1 200   0.24 secs:    2900 bytes ==> /faq.html
HTTP/1.1 200   0.24 secs:    2900 bytes ==> /faq.html
HTTP/1.1 200   0.24 secs:    2822 bytes ==> /apachebench_nginx.html
HTTP/1.1 200   0.26 secs:    3131 bytes ==> /siegebenchmark_nginx.html
HTTP/1.1 200   0.26 secs:    2900 bytes ==> /faq.html
HTTP/1.1 200   0.26 secs:    3131 bytes ==> /siegebenchmark_nginx.html
HTTP/1.1 200   0.27 secs:    2822 bytes ==> /apachebench_nginx.html
HTTP/1.1 200   0.28 secs:    2900 bytes ==> /faq.html
HTTP/1.1 200   0.30 secs:    3131 bytes ==> /siegebenchmark_nginx.html
HTTP/1.1 200   0.30 secs:    5763 bytes ==> /changelog.html
HTTP/1.1 200   0.30 secs:    2900 bytes ==> /faq.html
HTTP/1.1 200   0.30 secs:    2900 bytes ==> /faq.html
HTTP/1.1 200   0.30 secs:    2900 bytes ==> /faq.html
HTTP/1.1 200   0.29 secs:    2822 bytes ==> /apachebench_nginx.html
HTTP/1.1 200   0.31 secs:    4028 bytes ==> /index.html
done.
Transactions:                  30000 hits
Availability:                 100.00 %
Elapsed time:                 311.16 secs
Data transferred:             103.56 MB
Response time:                  0.16 secs
Transaction rate:              96.41 trans/sec
Throughput:                     0.33 MB/sec
Concurrency:                   14.94
Successful transactions:       30000
Failed transactions:               0
Longest transaction:            4.83
Shortest transaction:           0.09
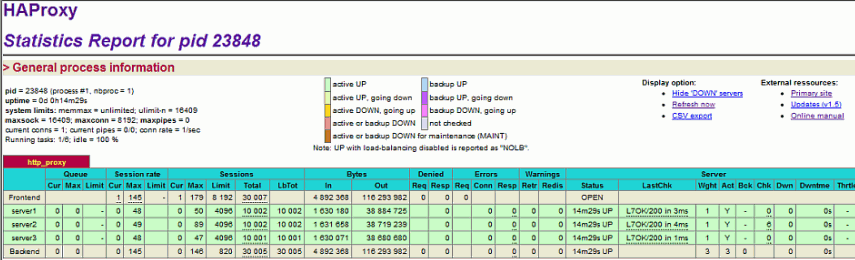
Haproxy load balancer + Centmin Mod Nginx web 3. Peaked at 1.30, 0.49, 0.19 cpu load
---------------------------------------------------------------------------
top - 12:00:11 up 34 days, 22:42,  1 user,  load average: 1.30, 0.49, 0.19
Tasks:  34 total,   4 running,  30 sleeping,   0 stopped,   0 zombie
Cpu0  :  0.1%us,  0.1%sy,  0.0%ni, 99.5%id,  0.3%wa,  0.0%hi,  0.0%si,  0.0%st
Cpu1  :  0.1%us,  0.1%sy,  0.0%ni, 99.5%id,  0.2%wa,  0.0%hi,  0.0%si,  0.0%st
Mem:   1048576k total,   142396k used,   906180k free,        0k buffers
---------------------------------------------------------------------------
             total       used       free     shared    buffers     cached
Mem:          1024        138        885          0          0          0
-/+ buffers/cache:        138        885
Swap:            0          0          0
---------------------------------------------------------------------------
Centmin Mod Nginx web 1. Peaked at 0.94, 0.26, 0.08 cpu load
---------------------------------------------------------------------------
top - 12:00:11 up 22 days,  7:01,  3 users,  load average: 0.94, 0.26, 0.08
Tasks:  30 total,   1 running,  29 sleeping,   0 stopped,   0 zombie
Cpu0  :  0.1%us,  0.2%sy,  0.0%ni, 99.0%id,  0.7%wa,  0.0%hi,  0.0%si,  0.0%st
Cpu1  :  0.1%us,  0.2%sy,  0.0%ni, 99.0%id,  0.7%wa,  0.0%hi,  0.0%si,  0.0%st
Mem:   1048576k total,   133616k used,   914960k free,        0k buffers
---------------------------------------------------------------------------
             total       used       free     shared    buffers     cached
Mem:          1024        129        894          0          0          0
-/+ buffers/cache:        129        894
Swap:            0          0          0
---------------------------------------------------------------------------
Centmin Mod Nginx web 2. Peaked at 0.67, 0.27, 0.09 cpu load
---------------------------------------------------------------------------
top - 12:01:46 up 10 days, 15:15,  2 users,  load average: 0.67, 0.27, 0.09
Tasks:  33 total,   1 running,  32 sleeping,   0 stopped,   0 zombie
Cpu0  :  0.1%us,  0.1%sy,  0.0%ni, 94.8%id,  5.0%wa,  0.0%hi,  0.0%si,  0.0%st
Cpu1  :  0.1%us,  0.1%sy,  0.0%ni, 94.0%id,  5.8%wa,  0.0%hi,  0.0%si,  0.0%st
Mem:   1048576k total,   129720k used,   918856k free,        0k buffers
---------------------------------------------------------------------------
             total       used       free     shared    buffers     cached
Mem:          1024        126        897          0          0          0
-/+ buffers/cache:        126        897
Swap:            0          0          0
---------------------------------------------------------------------------
Nginx worker connections and processes configuration - nginx.conf for all 3x 512MB / 1GB Burst OpenVZ based VPSes (web1-3)
user              nginx nginx;
worker_processes  1;

worker_rlimit_nofile 51200;

error_log         logs/error.log;

pid               logs/nginx.pid;

events {
    worker_connections  32768;
    use epoll;
}
Other Siege benchmark tests
- Siege benchmark test #1: Benchmark mode (3x VPS load balanced)
- Siege benchmark test #2: Internet mode (3x VPS load balanced)
- Siege benchmark test #3: Internet mode (4x VPS load balanced with adjusted Haproxy distribution weights)